Optogenetic dissection of descending behavioral control in Drosophila
authors: Jessica Cande, Shigehiro Namiki, Jirui Qiu, Wyatt Korff, Gwyneth M Card, Joshua W Shaevitz, David L Stern, Gordon J Berman
doi: 10.7554/eLife.34275
CITATION
Cande, J., Namiki, S., Qiu, J., Korff, W., Card, G. M., Shaevitz, J. W., Stern, D. L., & Berman, G. J. (2018). Optogenetic dissection of descending behavioral control in Drosophila. eLife, 7, e34275. https://doi.org/10.7554/eLife.34275
ABSTRACT
In most animals, the brain makes behavioral decisions that are transmitted by descending neurons to the nerve cord circuitry that produces behaviors. In insects, only a few descending neurons have been associated with specific behaviors. To explore how descending neurons control an insect’s movements, we developed a novel method to systematically assay the behavioral effects of activating individual neurons on freely behaving terrestrial D. melanogaster. We calculated a two-dimensional representation of the entire behavior space explored by these flies, and we associated descending neurons with specific behaviors by identifying regions of this space that were visited with increased frequency during optogenetic activation. Applying this approach across a large collection of descending neurons, we found that (1) activation of most of the descending neurons drove stereotyped behaviors, (2) in many cases multiple descending neurons activated similar behaviors, and (3) optogenetically activated behaviors were often dependent on the behavioral state prior to activation.
fleeting notes
-
screening behavior phenotypes using optogenetics
- one side has 6 control flies and the other side has 6 experimental flies
- ATR + / ATR -
- 3 cm plexiglass bubbles
-
opto protocol = 15s on, 45s off
-
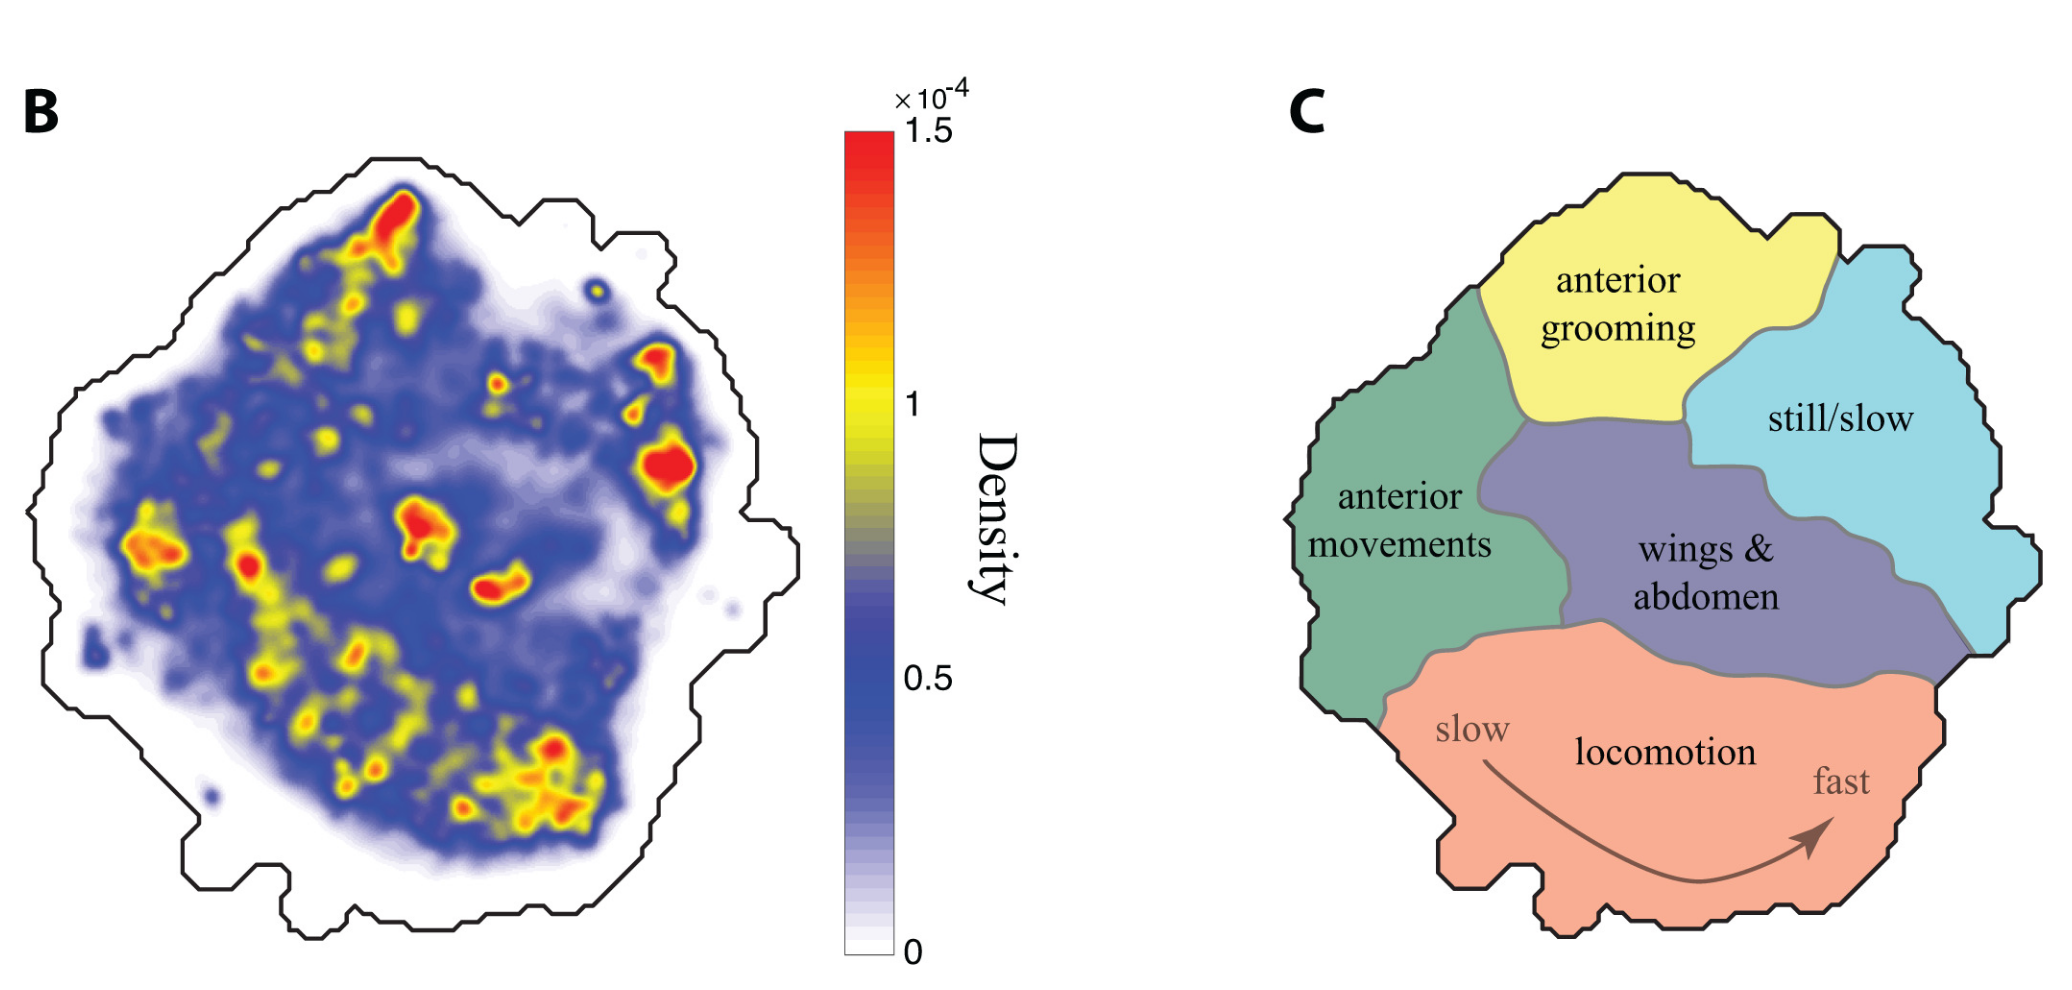
2d representation of behaviors mapped onto probability density function
-
human curated watershed regions in the space
- locomotion
- anterior movements
- wings & abdomen
- still/slow
- anterior grooming
-
created a full repertoire of fly behaviors then mapped the chr activation results into this space
- did they include all of the data from the previous datasets?
- Berman et al 2014 — more info about methods of creating the behavior map
-
if a DN line controls a specific behavior, then the representation in the behavior space should shift in a statistically significant way
-
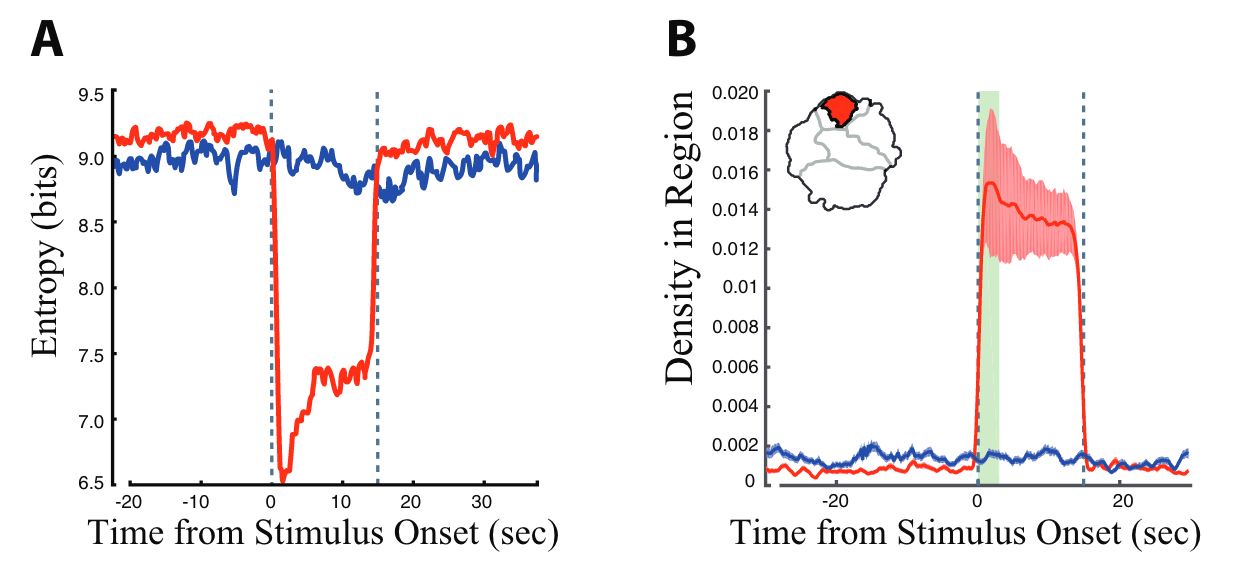
used entropy as a means to quantify opto activation phenotypes
- entropy is a measure of the degree of uncertainty inherent in the distribution of the flies in the behavior space
- flies can show any behavior when light is off, and probability of any one behavior in the density plot is low which corresponds to high entropy
- when the light turns on, the fly is more likely to be in a specific behavior space which minimizes the entropy
- this allows an unbiased measurement of finding if a DN drives a specific behavior without knowing ahead of time which behavior it may drive. basically looking for a loss of randomness of behaviors?
- also allows for identification of very subtle phenotypes not easily pulled out manually
-
most lines occupied only one behavior region
- some occupied multiple
-
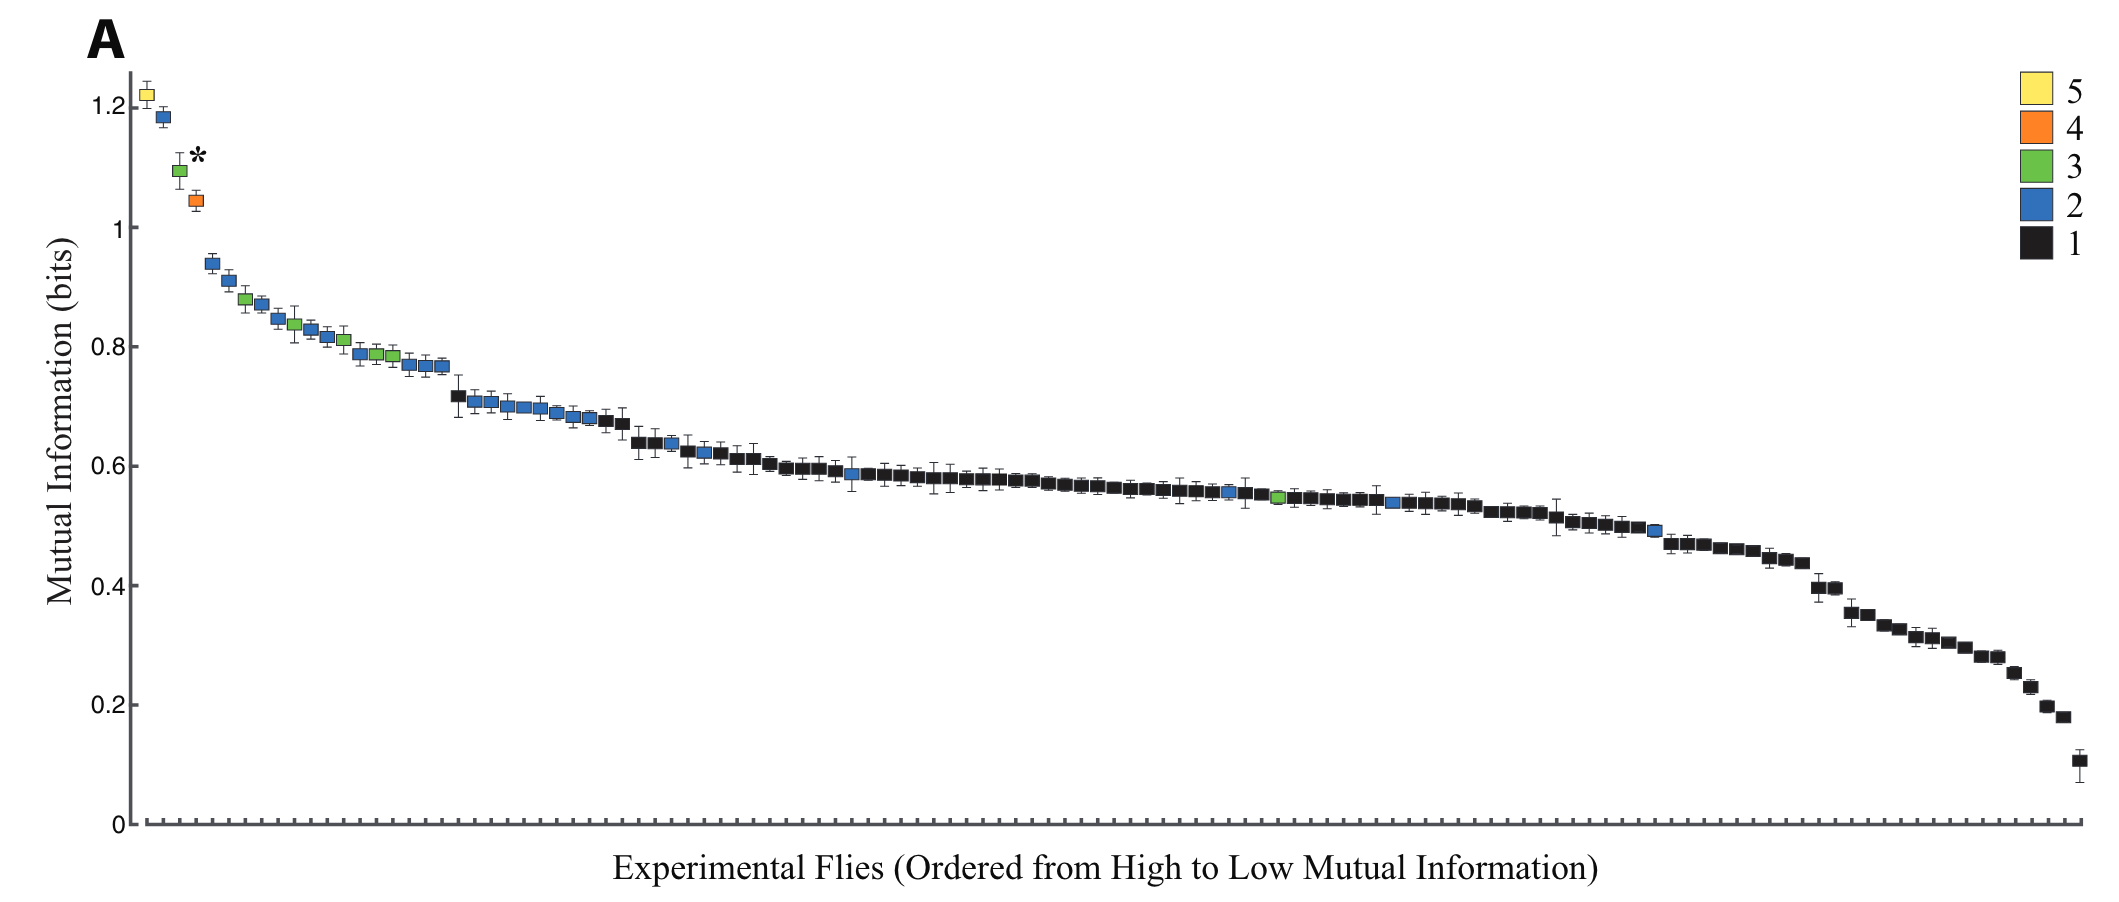
used mutual information to determine the behavioral context of flies
- mutual information compares density distribution of flies 1.5 to .5 seconds before the stimulus using “bits”
- high mutual information means the behavior before the stimulus informs the behavior after the stimulus
-
all experimental animals showed at least some mutual information
- the flies activity prior to the red light activation influenced whether or not it performed the behavior
-
descending neurons drive stereotyped behaviors
-
entropy reduction in low dimensional map reveals stereotyped behaviors
-
neurons with stereotyped functions are still context dependent
(notes written in this section wont be overwritten with each import)
highlights
“Entropy measures the degree of uncertainty inherent in the distribution of the flies in the behavior space.”Page 5
“==Mutual information is a non-linear measure of the degree of dependence between two variables and is typically measured in units of bits (Cover and Thomas, 2005). The higher the mutual information, the more the first variable, here the behavior of flies immediately prior to red light activation as measured by their distribution in the behavior space at t = 1.5 to 0.5 s, informs the value of the second variable, the region of the behavior space occupied in the first second of red light activation.==”Page 10